Excel: Advanced Training
Event Name: Excel: Advanced Training
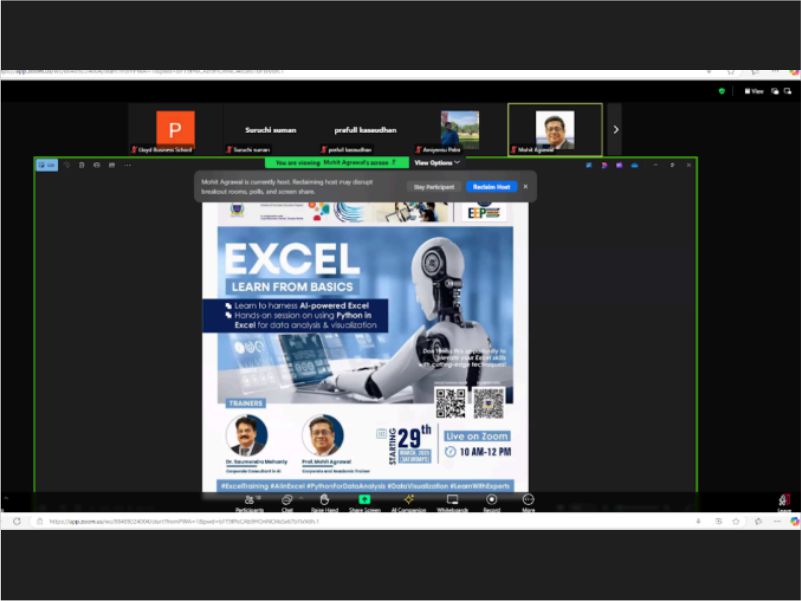
Event Date: Feb 15 – March 21, 2025
Faculty Coordinators: Prof. Mohit Agrawal and Dr. Saumendra Mohanty
Event Timings:10:00 AM-12:00 PM
Number of Participants: 25(Industry Professionals, Faculty Members, and Students)
Venue: Online
Objectives:
The objectives of the Advanced Excel Training Series were:
- To enhance participants’ proficiency in advanced Excel tools and functions
- To enable efficient data analysis, reporting, and visualization using Excel
- To introduce automation techniques for repetitive and time-consuming tasks
- To improve accuracy and productivity in business and research-related data handling
- To build confidence in using Excel for professional and analytical applications
Detailed Report:
The Advanced Excel Training Series was conducted as a four-day executive education program over the period from 15th February 2025 to 21st March 2025. The program followed a hands-on and application-oriented approach, allowing participants to practice concepts in real time.
Day 1: Fundamentals of Advanced Excel and Data Handling
The first day focused on revisiting essential Excel concepts and introducing advanced formulas and functions. Participants were guided through efficient data organization techniques and logical functions used in professional reporting. Live demonstrations and practice exercises helped participants understand how advanced Excel features improve accuracy and efficiency in data handling.
Day 2: Pivot Tables and Dynamic Reporting
On the second day, the training emphasized pivot tables and dynamic reporting techniques. Participants learned how to summarize large datasets, generate interactive reports, and customize pivot tables for analytical insights. Practical exercises using real-world datasets enabled learners to apply concepts immediately and understand their relevance in business decision-making.
Day 3: Automation and Dashboard Creation
The third day focused on automation tools and dashboard development in Excel. Participants were introduced to techniques that reduce manual effort in repetitive tasks. The session also covered the creation of dashboards and visual reports, helping participants present data in a clear and impactful manner. Hands-on practice strengthened participants’ ability to design professional dashboards.
Day 4: Practical Applications, Case Studies, and Consolidation
The final day concentrated on applying learned concepts to real-world case studies. Participants worked on integrated exercises combining formulas, pivot tables, automation, and visualization. Interactive discussions and Q&A sessions addressed participant queries. The program concluded with a recap of key concepts and guidance on best practices for using Excel in professional and analytical roles.
Learning Outcomes:
At the end of the Advanced Excel Training Series, participants were able to:
- Apply advanced Excel formulas and functions confidently
- Create dynamic reports and pivot tables for data analysis
- Automate repetitive tasks to improve efficiency and accuracy
- Design professional dashboards and visual reports
- Use Excel effectively for business, academic, and research purposes
- Registeration link: Register now: https://forms.gle/74x44L4Ara9YYzhNA