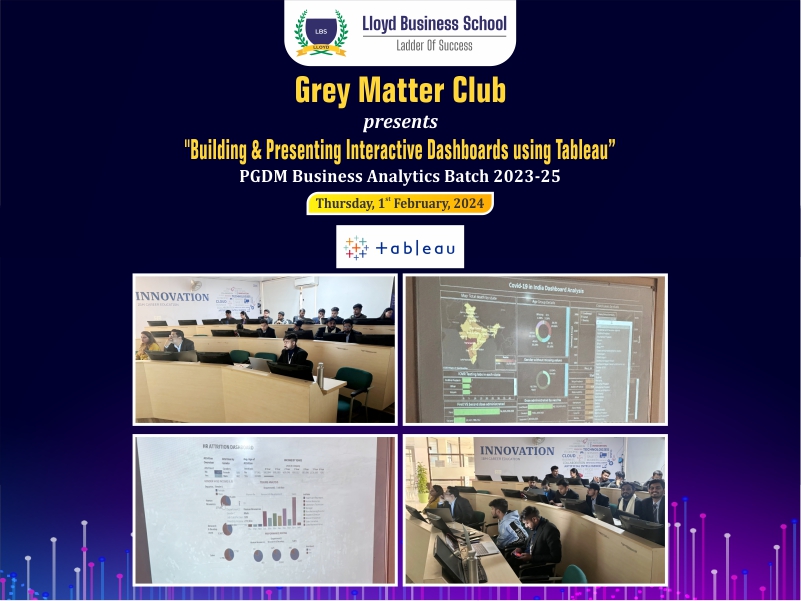
Building & Presenting Interactive Dashboards using Tableau
| Event Name: Building & Presenting Interactive Dashboards using Tableau | Event Date: February 1st, 2023 |
| Faculty Coordinators: Mr. Mohit Agrawal, Ms. Neha Issar | Event Timings:1:30 to 3pm |
| Number of Participants:38 |
OBJECTIVE:
This initiative aims to assess the students' proficiency in Tableau and provide guidance where necessary, addressing the crucial Tableau skills required for industry employability.
Detailed Report:
Introduction to Tableau: Participants introduced the Tableau interface, data sources, and basic functionalities.
Data Visualization Fundamentals: The workshop covered key principles of data visualization, including chart types, color palettes, and design considerations.
Building Interactive Dashboards: Participants structured the dashboards, use filters and actions, and create dynamic visualizations.
Storytelling with Data: Techniques for using dashboards to effectively communicate insights and tell compelling data stories were explored.
Hands-on Exercises: Participants completed a series of guided exercises to practice building and presenting dashboards with real-world datasets.
Key Learnings:
Participants imported and connected to various data sources in Tableau.
They created different chart types and customized their appearance for effective communication.
Participants gained hands-on experience with filters, actions, and other interactive elements to create dynamic dashboards.
They designed creative, visually appealing and informative dashboards.
Participants developed skills in using dashboards to communicate data insights effectively.
Feedback and Recommendations:
Participants were highly appreciated on the hands-on exercises and real-world examples used throughout the workshop.
Overall, the workshop received positive feedback and was considered valuable for building skills in data visualization and dashboard creation with Tableau.
Participants were encouraged to continue practicing their Tableau skills and explore the software's advanced features.
Follow-up workshops or one-on-one support could be offered to address specific needs and deepen learning.
Conclusion:
This workshop successfully equipped participants with the knowledge and skills to build and present interactive dashboards using Tableau. By combining theoretical concepts with hands-on practice, the workshop provided a valuable learning experience for individuals seeking to improve their data visualization and communication skills.